Keep an eye on your self-hosted services with statping-ng

Self-hosting services and websites can be a nerve-racking experience - especially if other people are relying on the infrastructure you provide.
You need to know what services are running, how well they're performing, and be instantly alerted to any problems.
Statping-ng is an uptime monitor and dashboard that can keep track of any number of services and send you alerts when there's a problem.
In other words (and this was a strong candidate for the article title), statping-ng supplies seamless self-hosted sites and services surveillance and stability.
Why use an uptime monitor when self-hosting services and sites?

Running your own sites and services as a replacement for proprietary offerings from tech giants is a liberating experience. It takes away from the world of surveillance advertising, and gives you a degree of independence to own your own stuff on your own little corner of the internet.
Here at the Linux Impact mansion we run almost everything from a Raspberry Pi 4B, and while we don't have space to list everything we self-host, a few highlights include Snikket as a WhatsApp alternative; Immich (which is far superior to Google Photos); Trilium instead of Evernote; Jellyfin as a replacement for Netflix and Spotify; Audiobookshelf as a home for our audiobooks.
There are more self-hosted services, of course, including email services, and 'proper' websites, but these are the ones we rely on, and more to the point. They're the ones our family and a limited group of friends rely on, too.
They're too important to have any significant downtime beyond the occasional system reboot.
Sometimes things fail. Maybe it's that a Docker container failed to start; perhaps you're being DDoSed; occasionally apps crash for no discernible reason at all.
The point is that you need a system where you can monitor performance, and know instantly when something goes wrong.
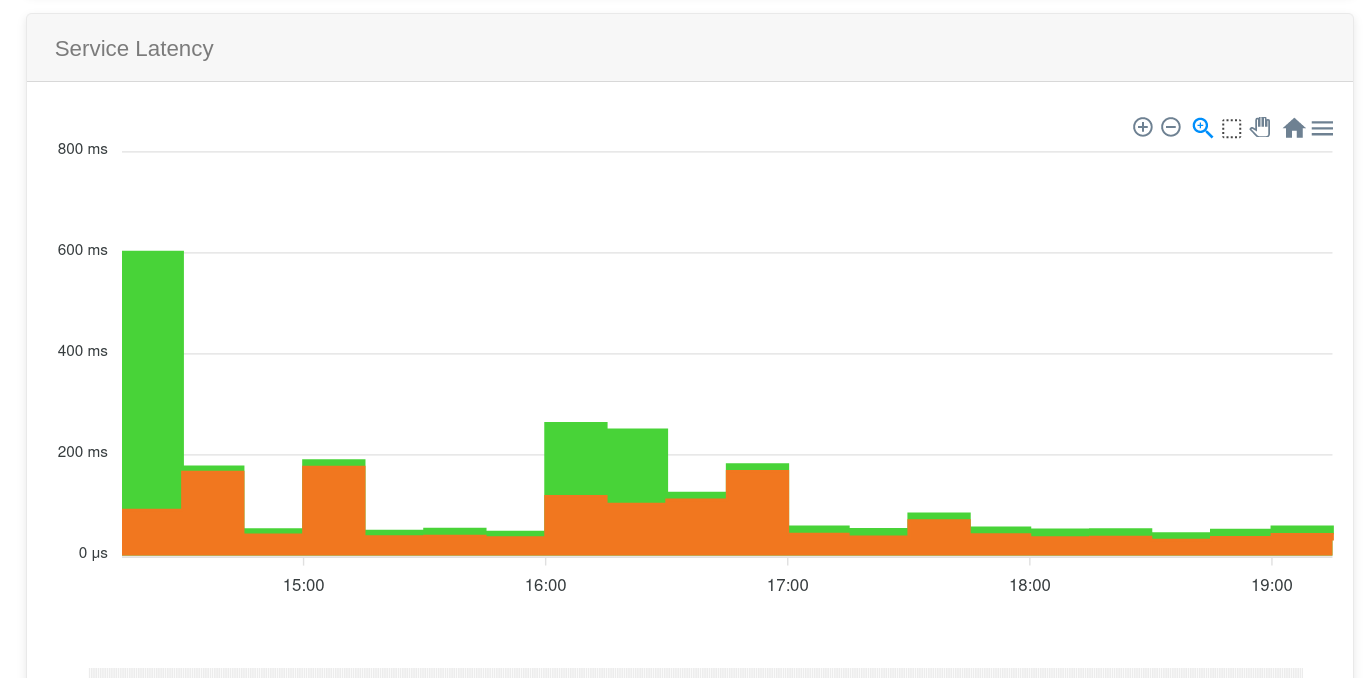
statping-ng is a self-hosted app that will periodically ping your sites and services, create graphs, and let you know when something's wrong.
Ideally you should host statping on an entirely different physical server from the services you're monitoring. It's very lightweight, and we're running our instance on a bargain basement $10 / year Racknerd VPS (also in use as a mail server).
It shouldn't be too big of an issue if you host it on your Raspberry Pi along with everything else though.
How to install statping-ng on Linux
The easiest way to install statping-ng on your server is by using the ready-made script. Just make sure you have curl installed:
sudo apt install curl...then use curl to download the script and pipe it to bash:
curl -o- -L https://raw.githubusercontent.com/statping-ng/statping-ng/stable/install.sh | bash We prefer to use a dockerised solution, as it gives us more control. Either way is good, but if you prefer to follow our example, make sure you have Docker and Docker Compose installed, then create a new directory within your home directory, and use the cd command to move into it:
mkdir statping-ng && cd statping-ngUse the nano text editor to create a new file for Docker compose:
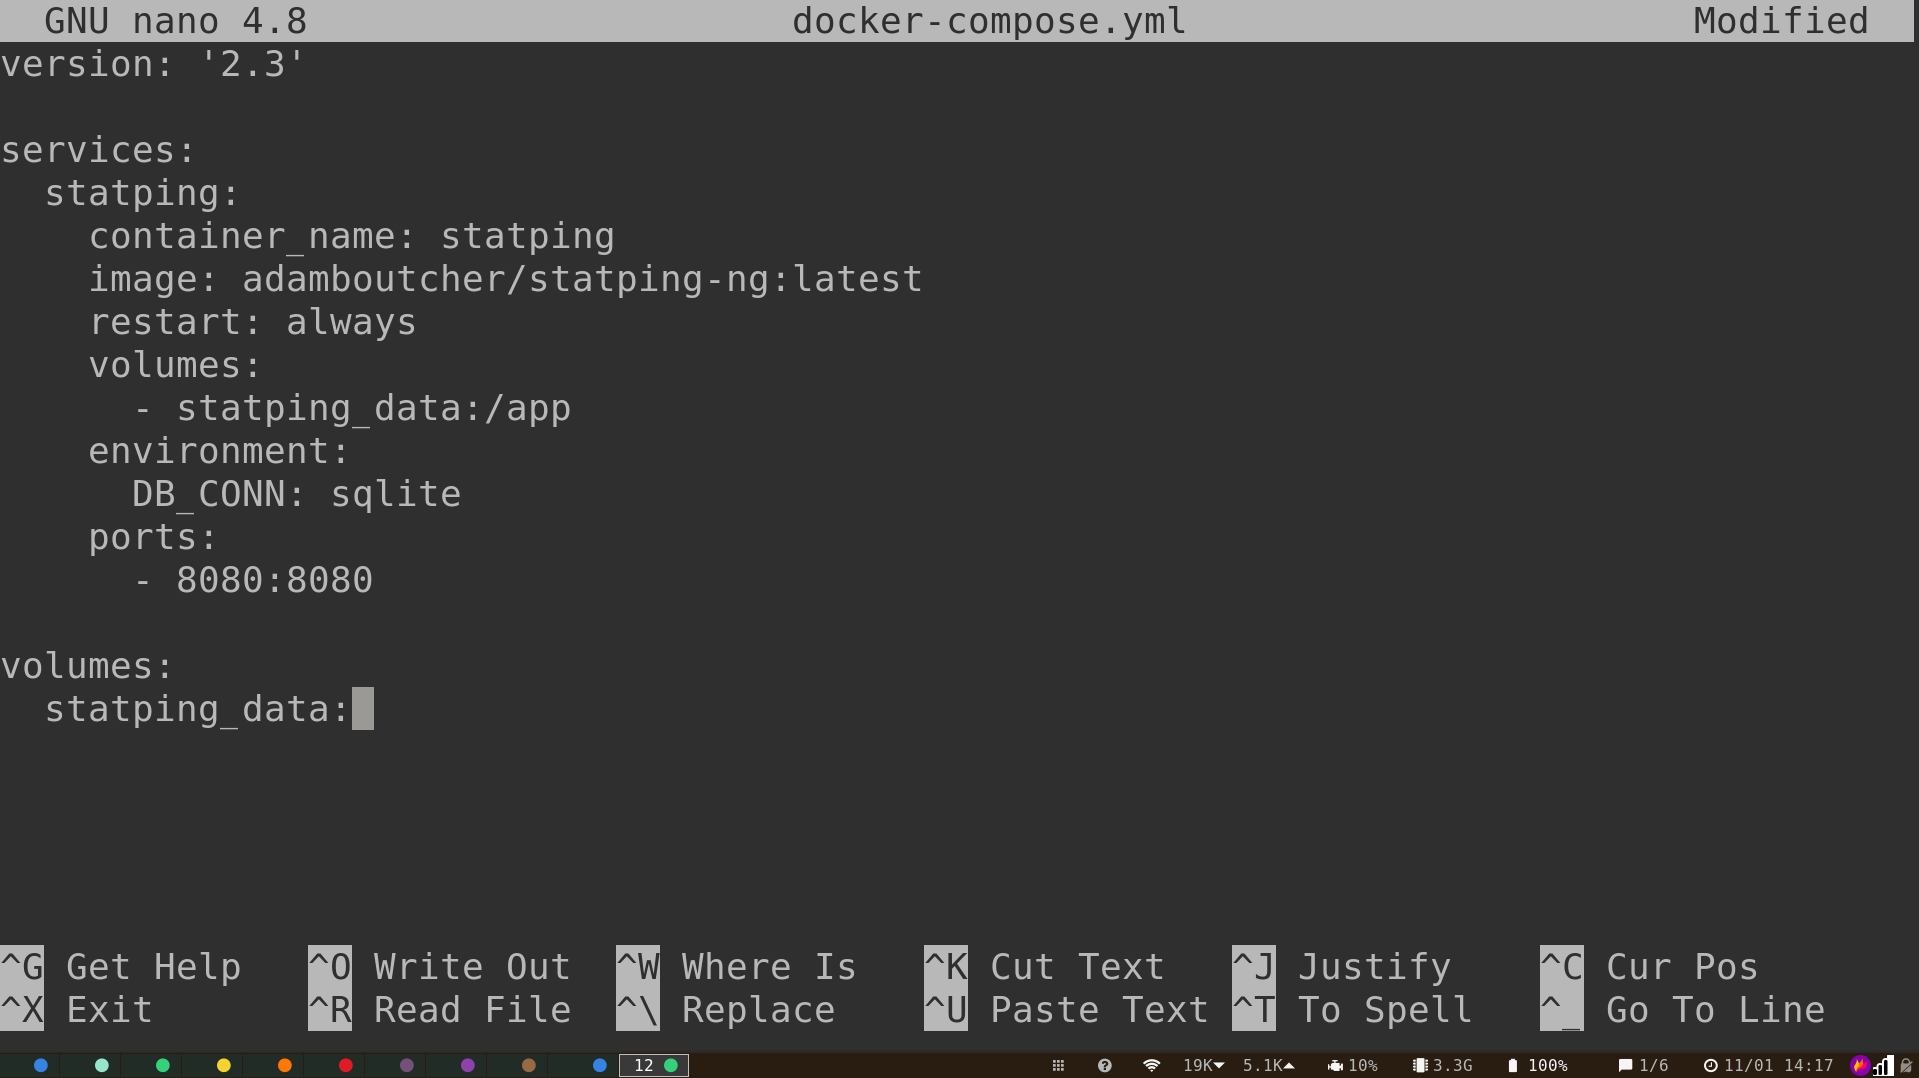
nano docker-compose.ymlIn it, paste the following:
version: '2.3'

services:
  statping:
    container_name: statping
    image: adamboutcher/statping-ng:latest
    restart: always
    volumes:
      - statping_data:/app
    environment:
      DB_CONN: sqlite
    ports:
      - 8080:8080

volumes:
  statping_data:
If you're running other services on port 8080, make sure you change the port number.
Save and exit nano with Ctrl + O then Ctrl + X.
The following command will download the relevant images and set up containers for statping-ng:
docker-compose up -dNow visit your statping-ng instance at your.server.ip.address:8080/login
Log in with the username admin, and the password admin, then go to Users and change these credentials to something more secure.
You'll want to access statping-ng over the internet, so head over to your registrar and create a new domain or subdomain. Set the value as your server or home IP address and the TTL as low as possible.
Back on your server, make sure you have the necessary Apache mods enabled:
sudo a2enmod proxy proxy_http rewriteCreate a new config file for Apache:
cd /etc/apache2/sites/available
sudo nano statping-ng.conf
In the new file, paste the following:
<VirtualHost *:80>
ServerName your-domain.tld
ProxyPass / http://127.0.0.1:8080/
ProxyPassReverse / http:/127.0.0.1:8080/
ProxyPreserveHost On
</VirtualHost>
Save and exit nano with Ctrl + O then Ctrl + X
Enable the site, and restart Apache with:
sudo a2ensite statping-ng.conf
sudo service apache2 restart
At this point, you should be able to reach your statping-ng instance, by typing the address into the URL bar of your browser, but because you're connecting over HTTP rather than HTTPS, you're vulnerable to man in the middle attacks.
Certbot is an easy-to-use tool you can deploy to manage your TLS keys, certificates, and encryption. If you don't already have it on your server, install it now by entering:
sudo add-apt-repository ppa:certbot/certbot
sudo apt update
sudo apt install certbot
Run Certbot to fetch new certificates and keys:
sudo certbotFollow the prompts, and select your statping-ng domain name from a list. Choose to automatically updrage all connections, and when you're returned to the prompt, restart Apache once more with:
sudo service apache2 restartThat's it. Statping-ng is installed, secured, and you can access it via your domain name over HTTPS!
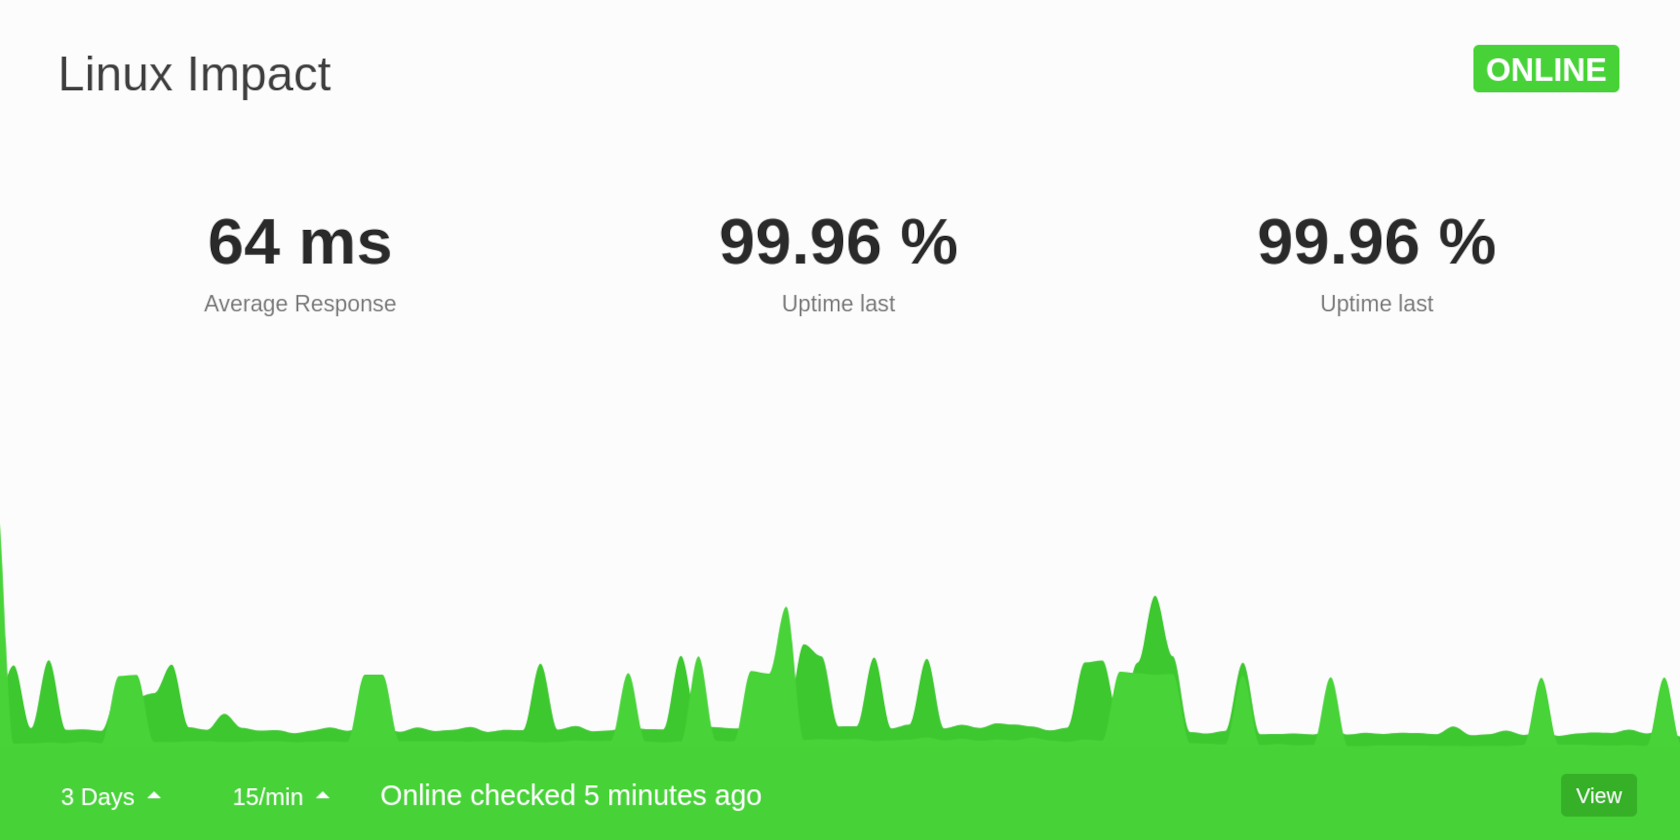
Set up statping-ng as a self-hosted status page for all your sites and services!
Type your domain name into the URL bar of any browser and you'll be greeted with the Title, "Statping Sample Data", and the revelation that, "This status page has sample data included".
The sample data contains uptime stats for sites including GitHub, Google, and some API endpoints. As useful as this information is, it's not your information.
Visit your-domain.tld/dashboard/services, and log in.
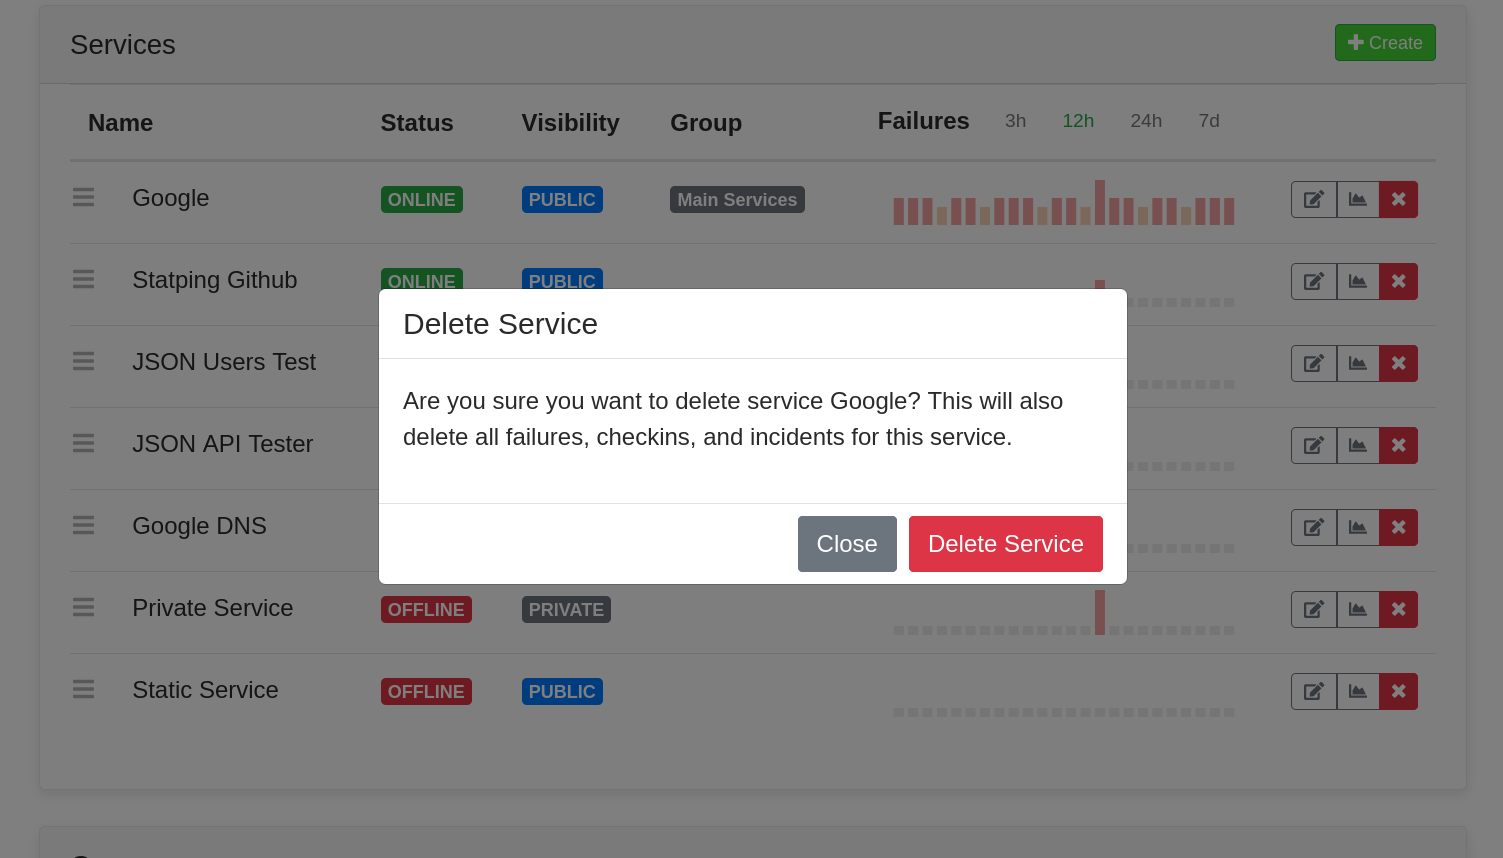
Unless you especially want to keep monitoring to see if Google goes down, click the red X icon next to all of the services and groups.
The next thing thing you should do is create groups for your services. These can be whatever you want. We created one for conventional websites such as this one; one for services that we share with others, and one for services that have only one user (this writer). This allows us to prioritise and see the important stuff at a glance. If our Mealie instance goes down, it's not a huge deal, but if our mail or audiobook servers drop offline at 2.30 AM, we're out of bed and dealing with it. You can also easily toggle group visibility so the associated services don't show to users who aren't logged in.
Add new services by clicking the green Create button, at the top right of the services page, and you'll find a bunch of boxes. Don't worry, you can leave most of these as they are. You'll need to give your service a name, and choose whether it's HTTP, TCP, UDP, gRPC, static, or if you just want an IMCP ping. A permalink URL means you can go directly to the status page of a service, so make it short and sweet. You'll find the page at your-domain.tld/service/permalink-name.
The Public Service toggle is self explanatory, and you'll need to specify a Check Interval. This is how often you want statping-ng to check if your service is still alive - 60 seconds is good in our opinion.
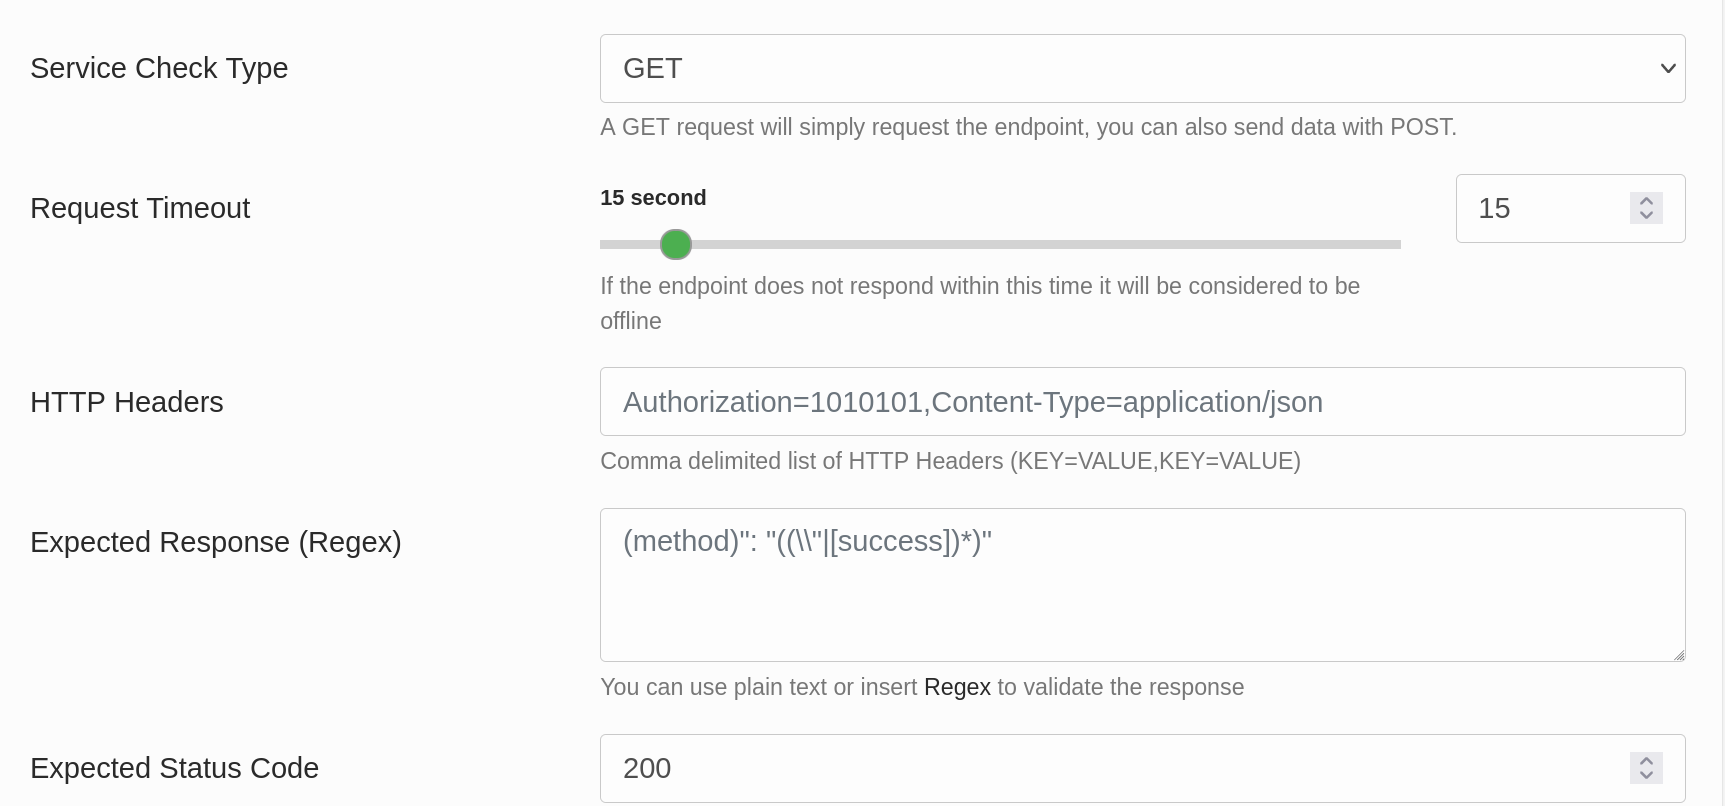
Service Endpoint is the URL you want to query - in most cases this will simply be the domain name or subdomain of your service, and by default the type will be a simple GET request. You can change this in the drop-down, and additionally select from POST, DELETE, PATCH, or PUT.
Below this, you can specify the expected response and status codes. The default is 200, but again, you can set this whatever you want.
Lastly, you'll want to tailor your notifications. You can have them turned off entirely if you prefer, and choose how many failed requests will trigger a notification to drag you from your otherwise busy and fulfilling day.
When you're done, click the big green Create service button.
Get notified of failing services with statping-ng
Head over to Settings, and you'll see a wealth of options. You'll definitely want to change the Status Page Name to something memorable, and set a witty one-liner for the description. If your native language is something other than English, you have a choice of Spanish, French, Russian, German, Czech, Japanese, Italian, Korean, or Chinese.
While you're here, you can also configure a theme, setup OAuth, and import or export your current Statping services, groups, notifiers, and other settings to a JSON file.
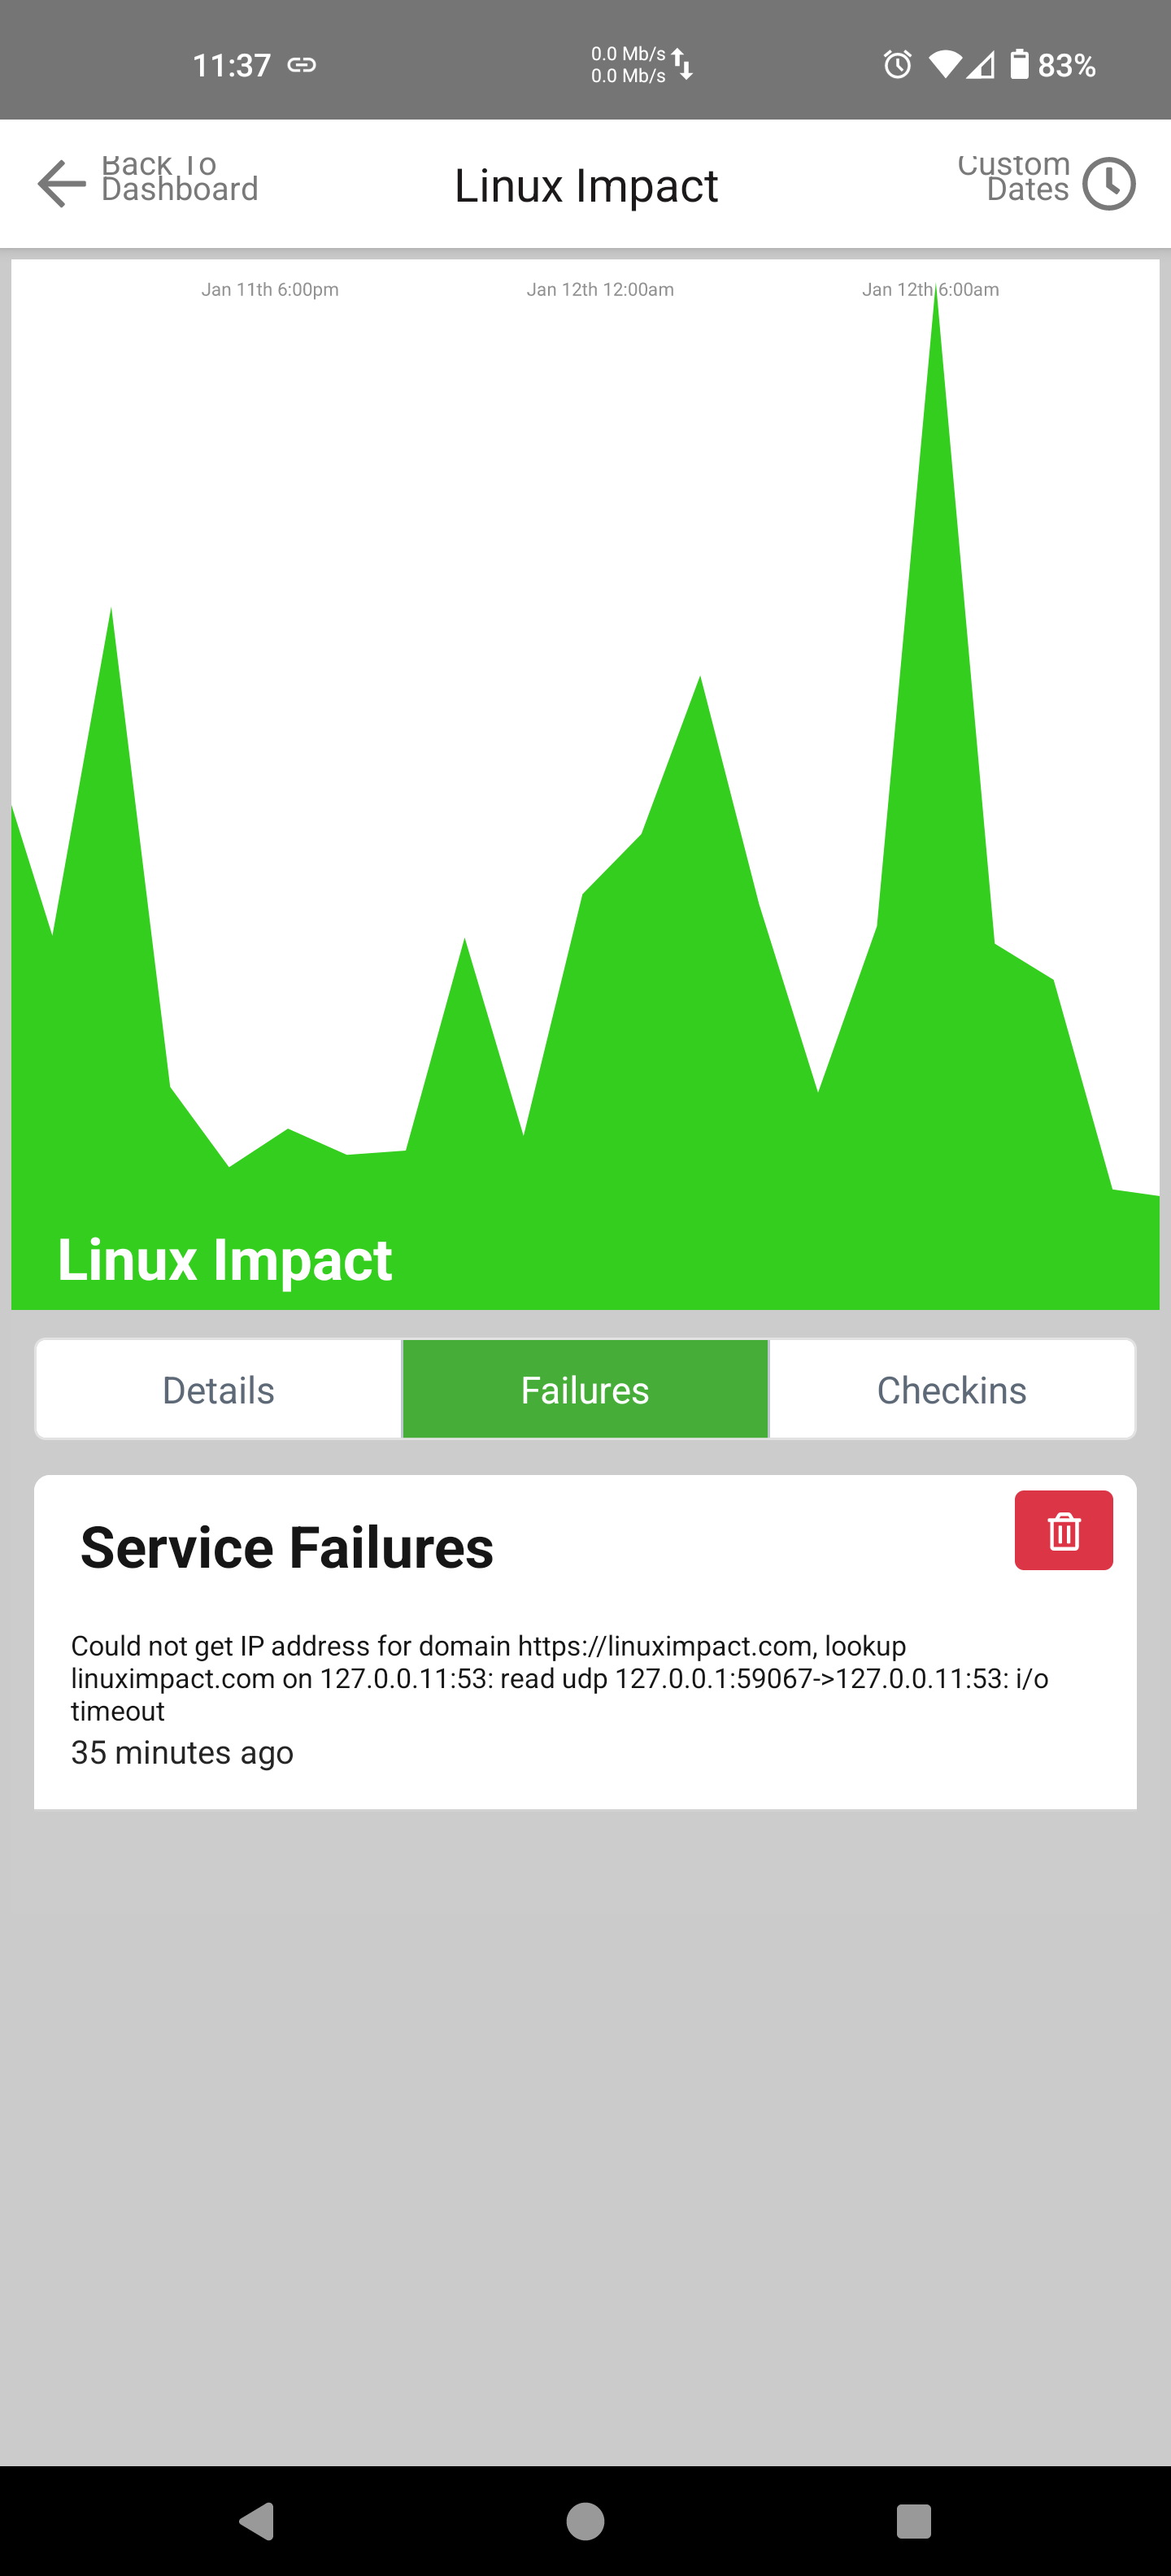
The big thing is the notifiers section, and statping-ng can notify you of failing or dead services in no few than 14 different ways including via email, Discord, Slack, Telegram, Mattermost, and via the Statping mobile app (Statping on Google Play | Statping on iOS).
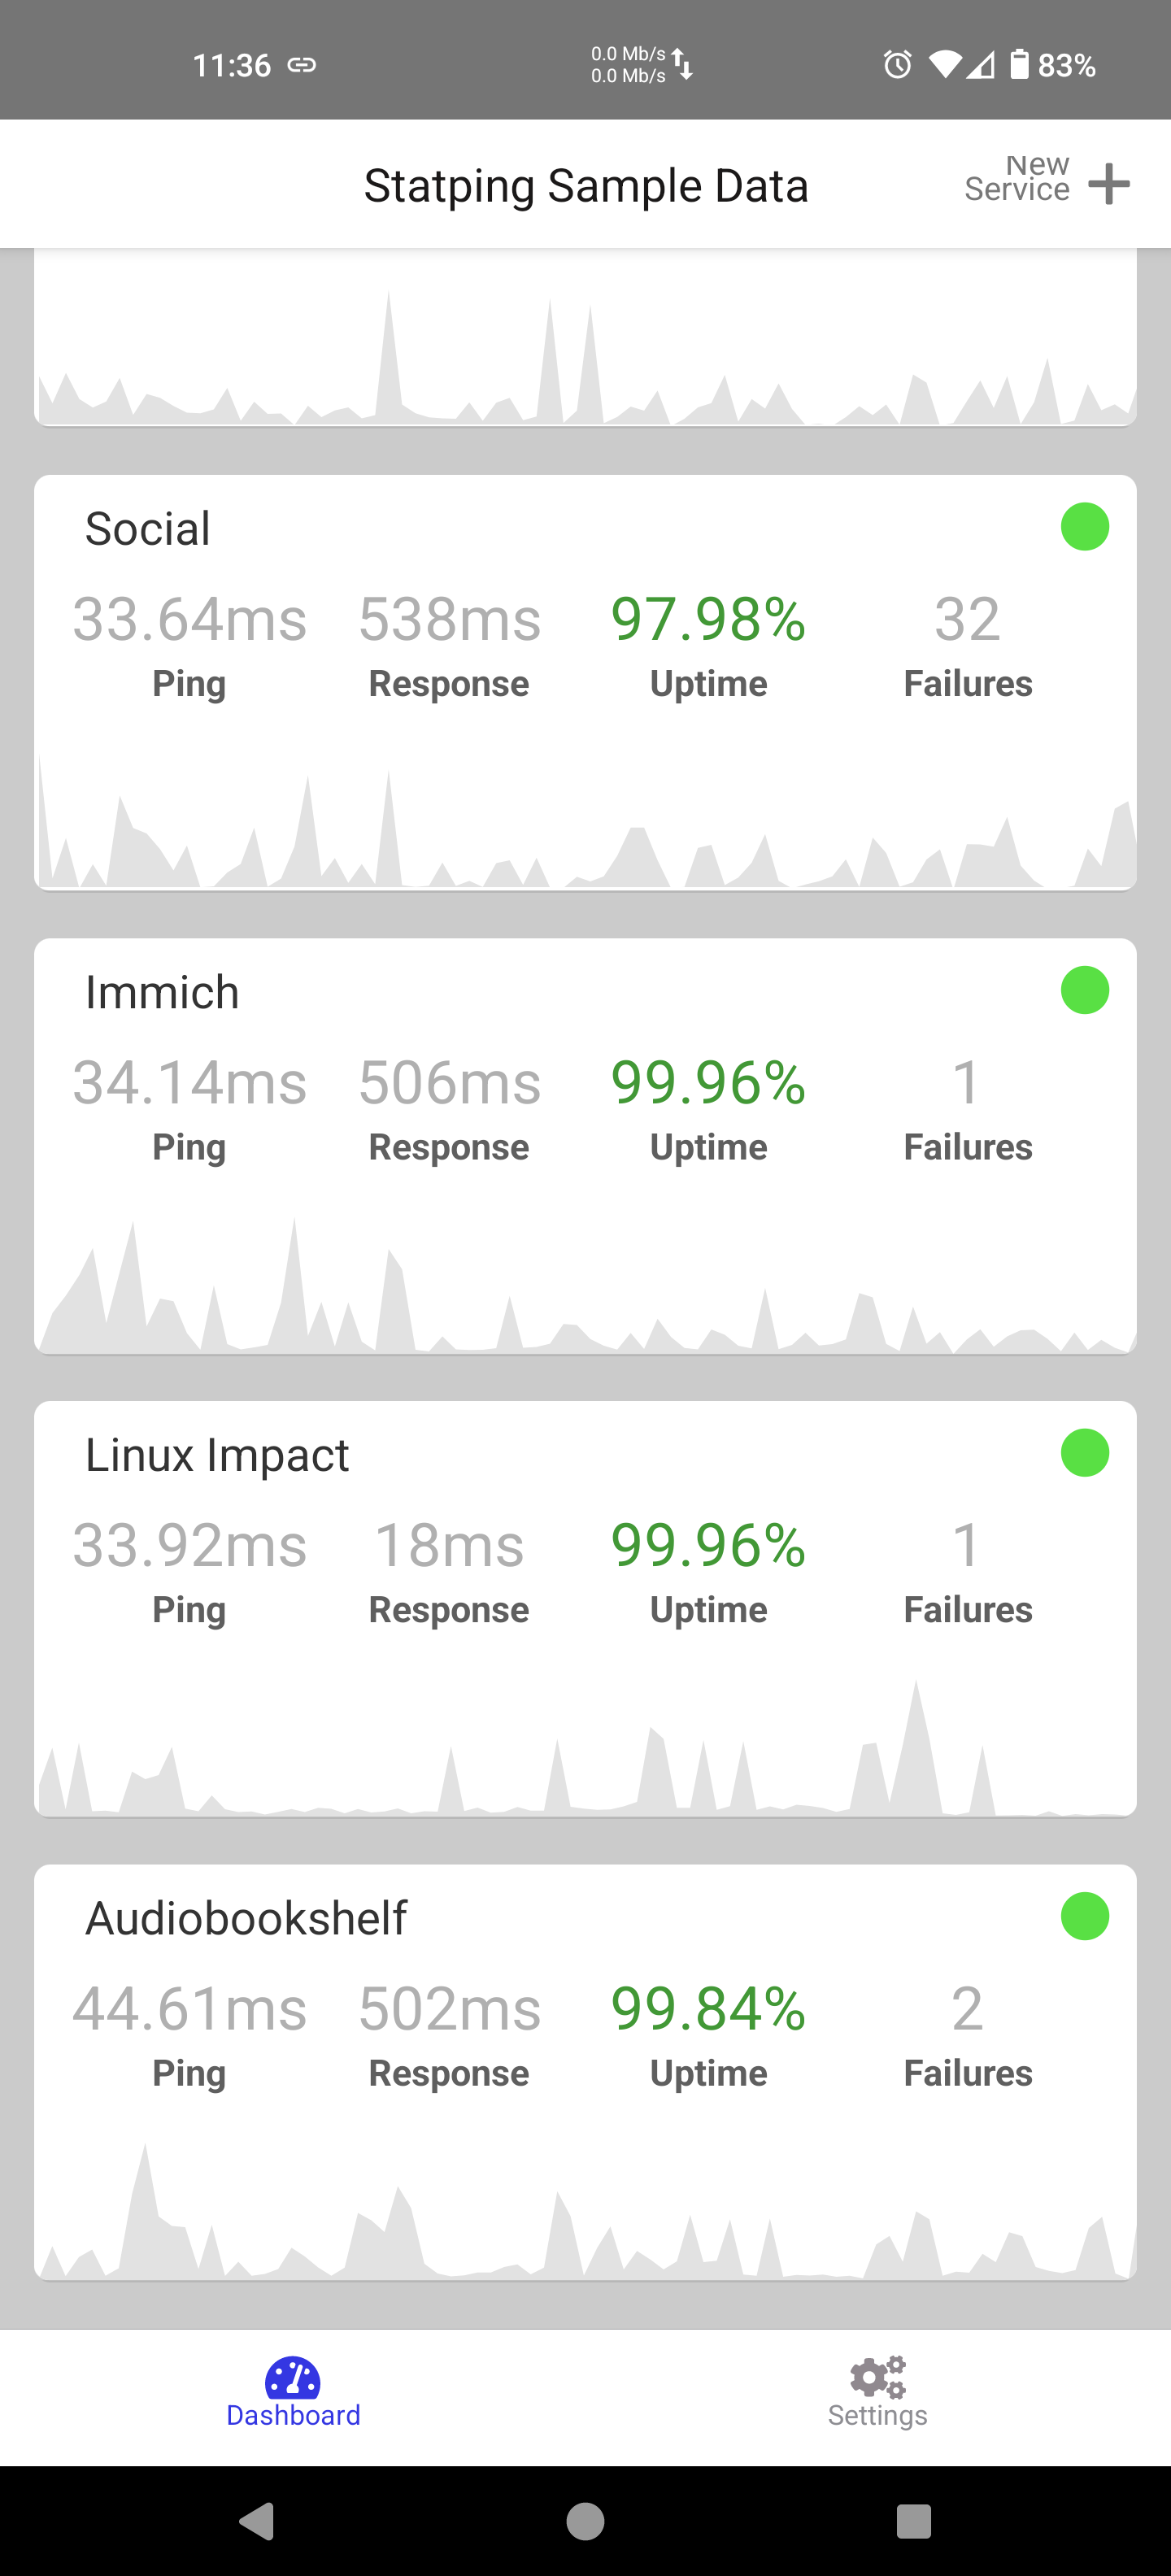
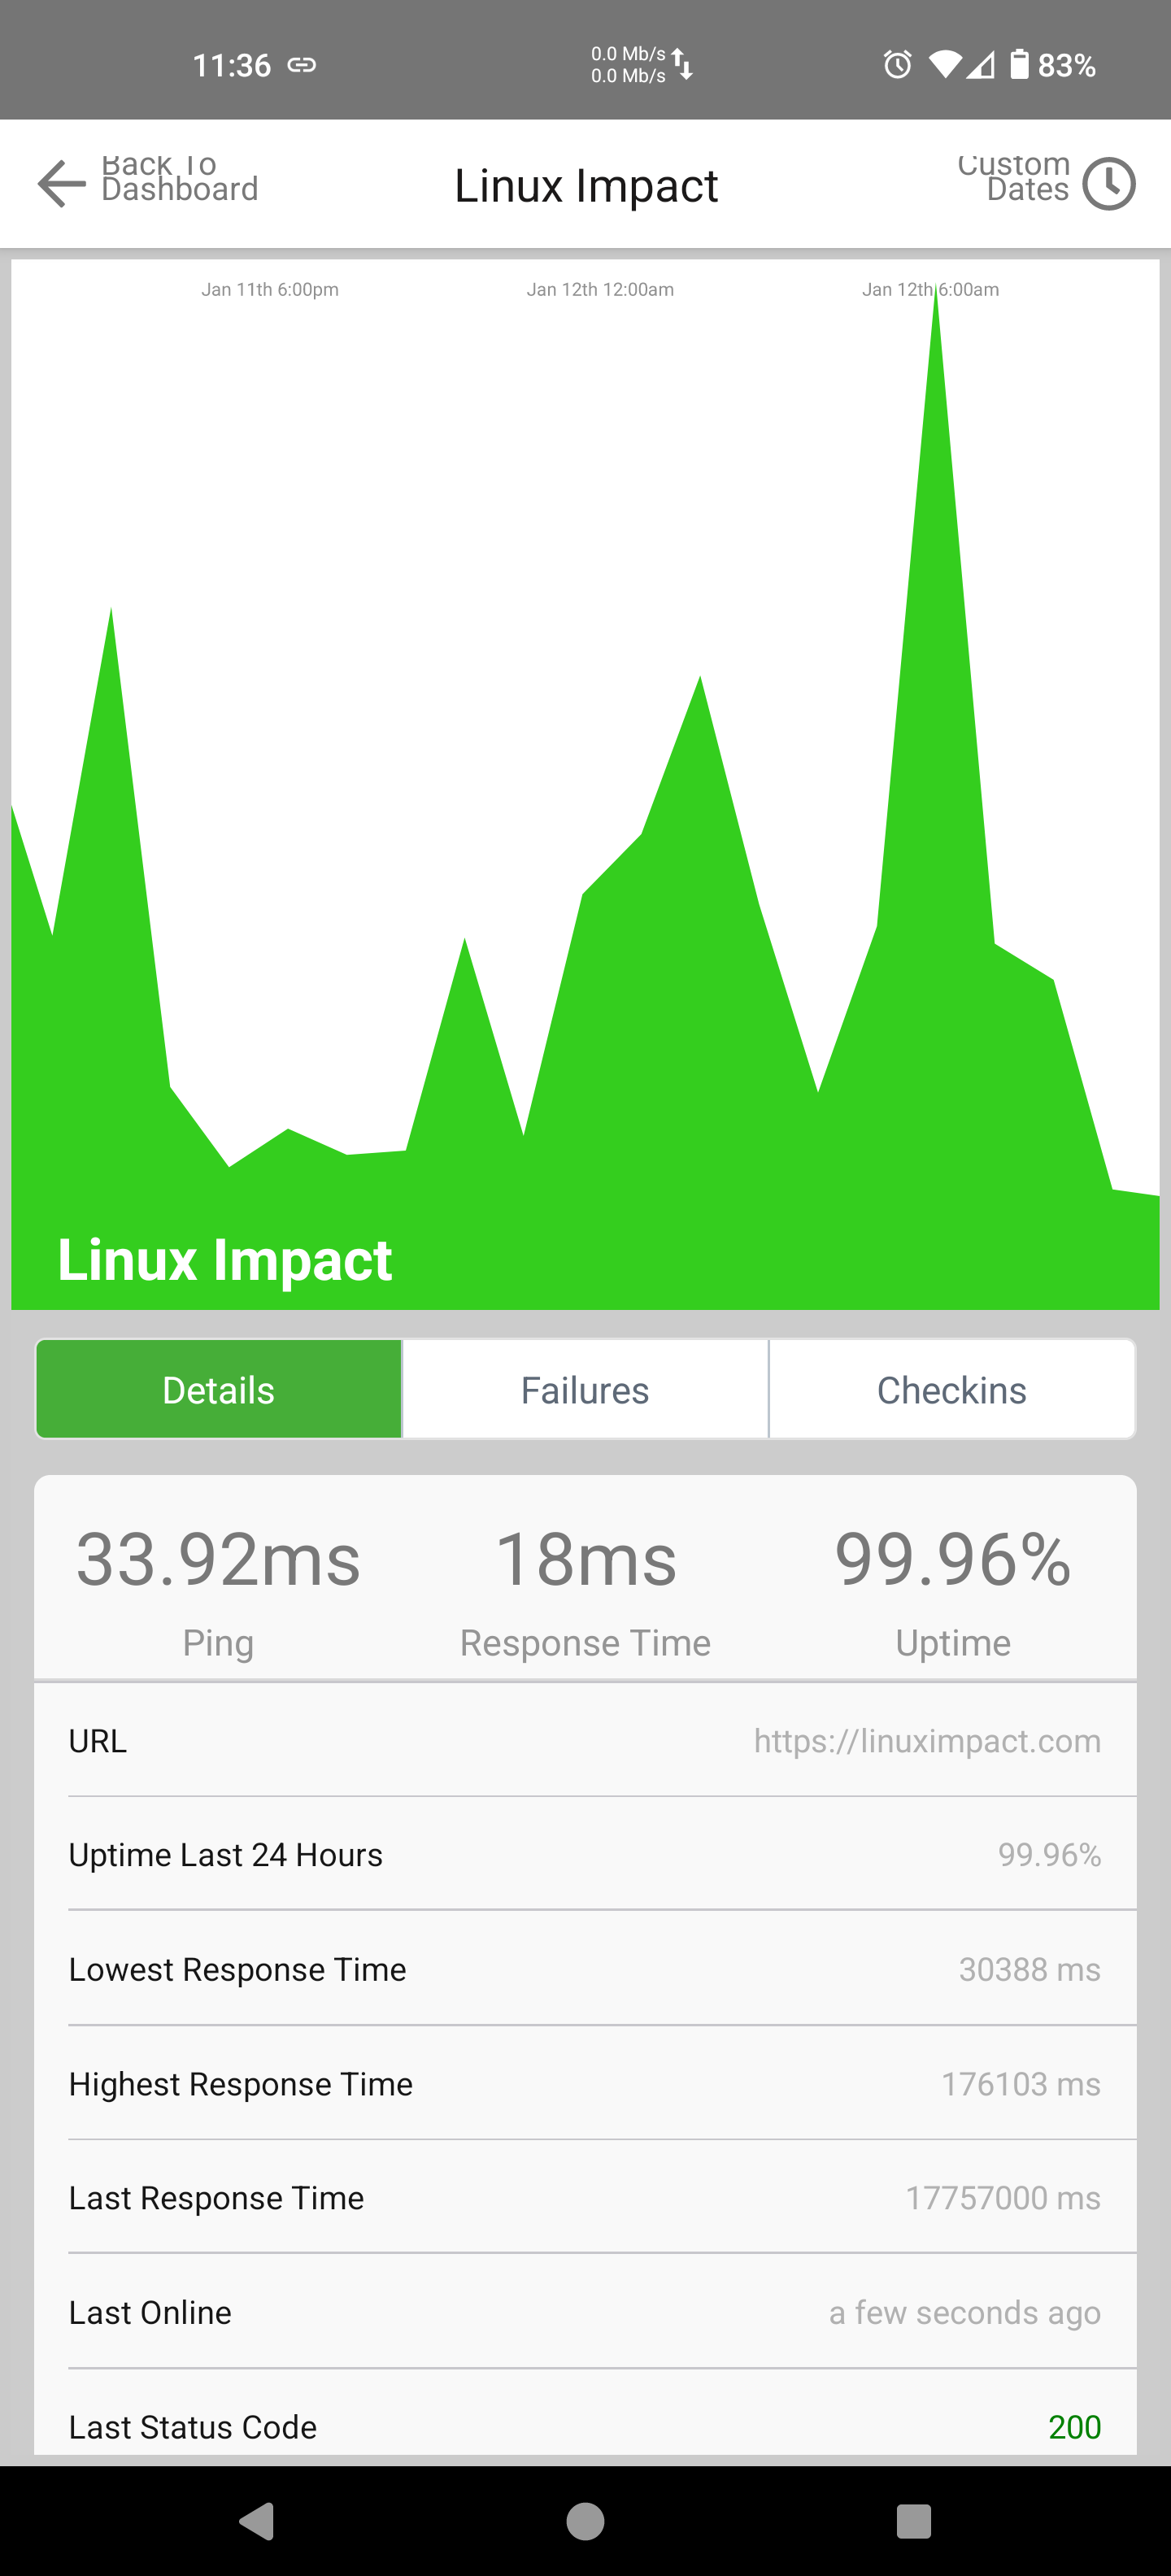
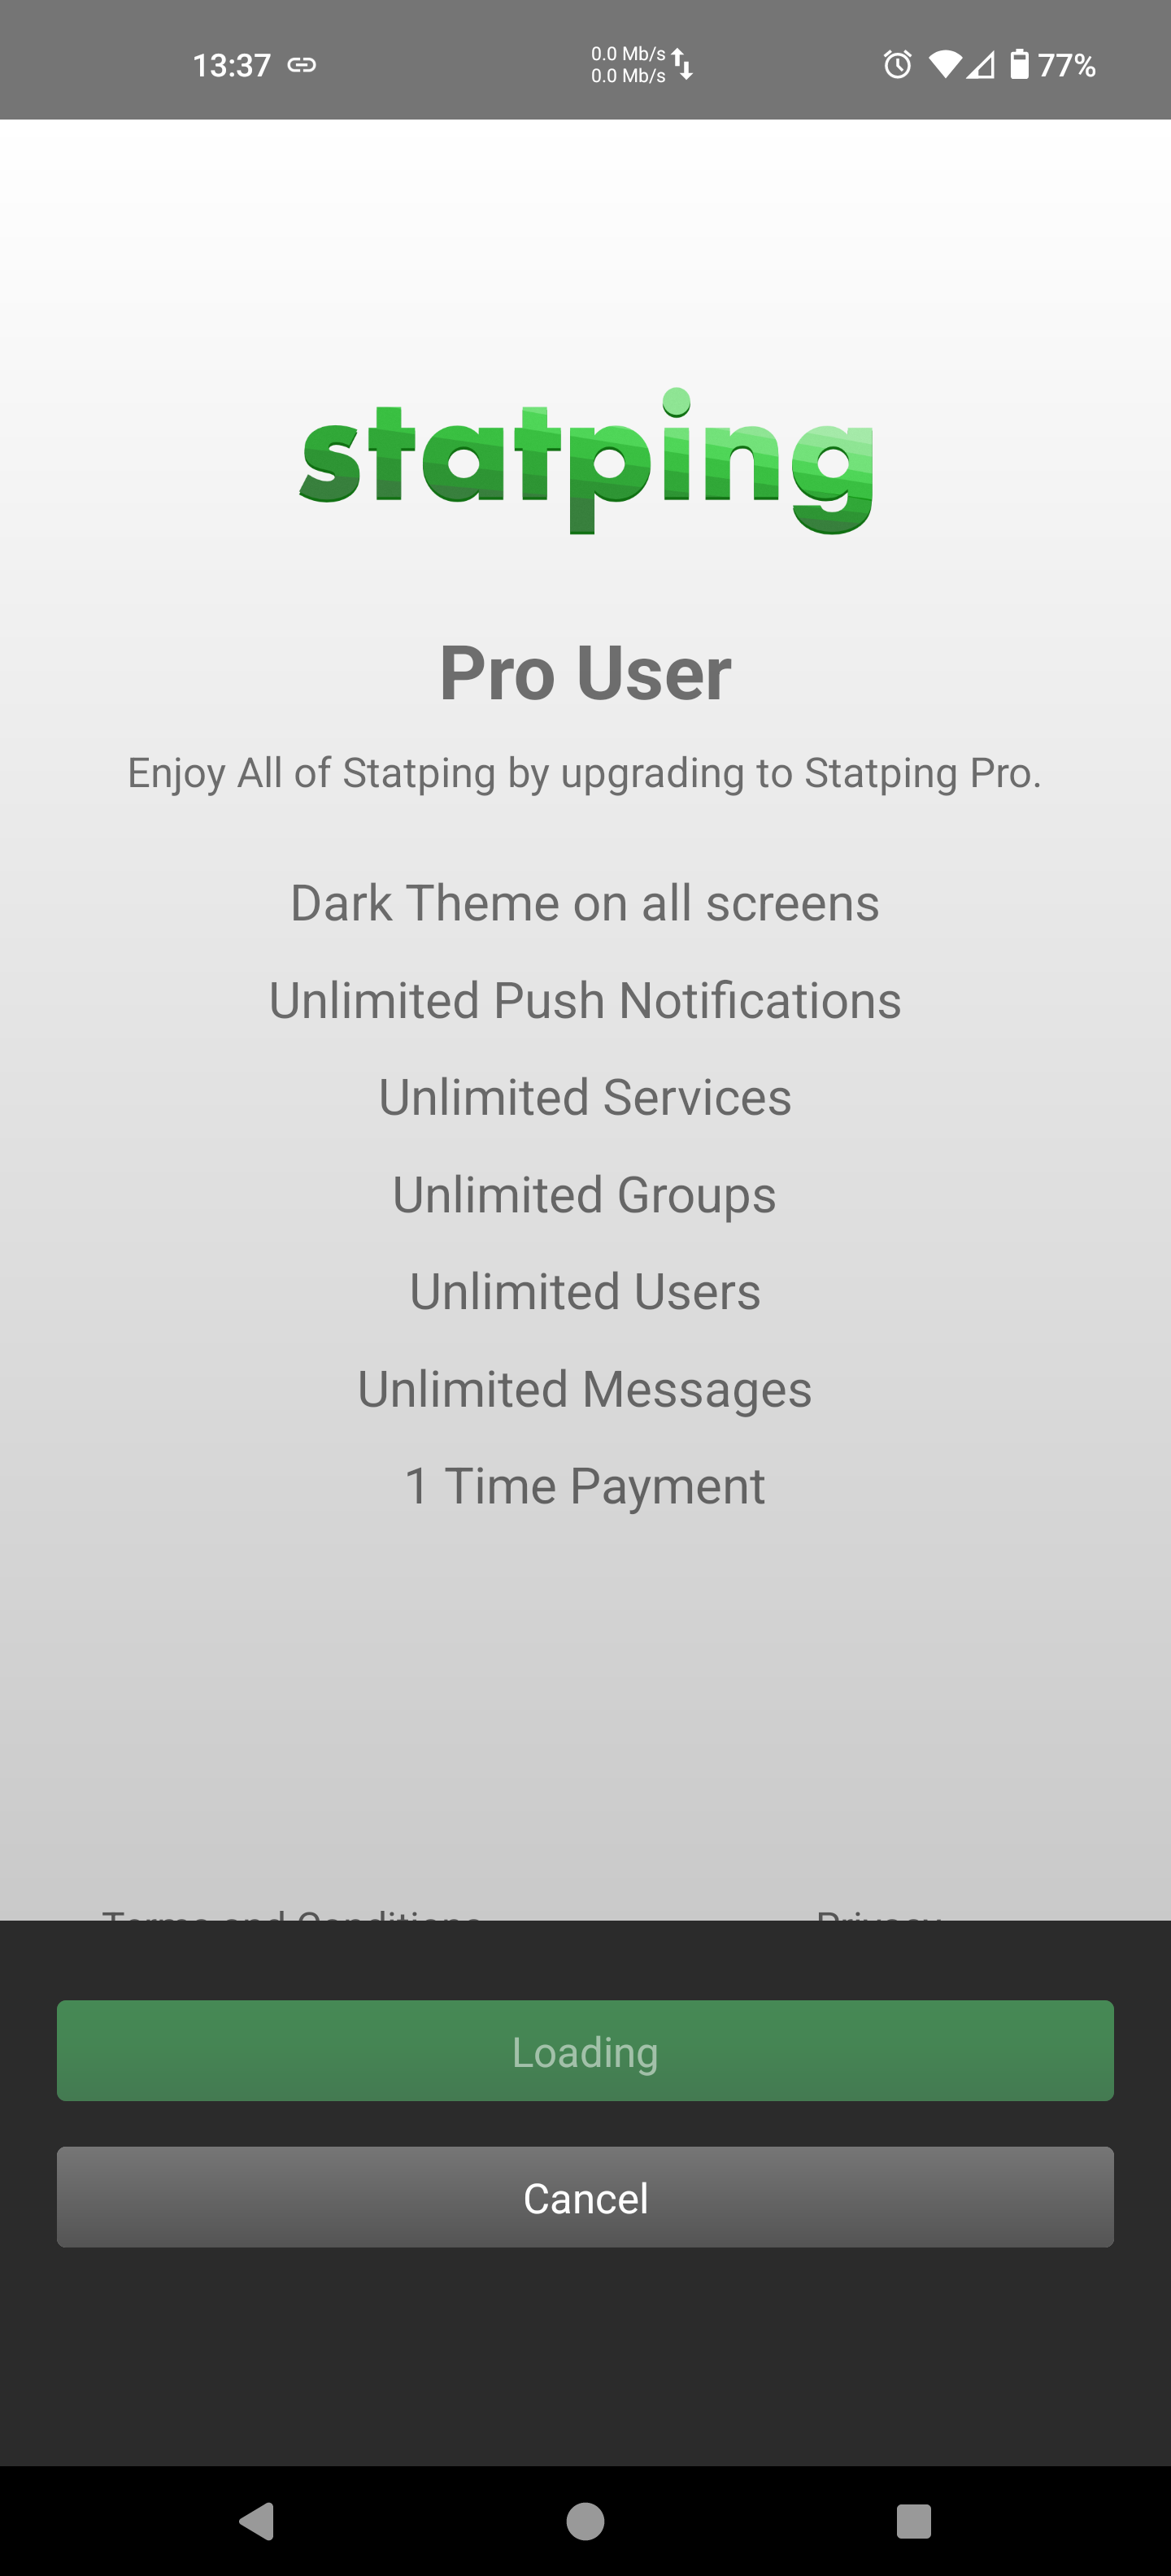
We recommend the dedicated app for a few reasons. In addition to the notifications, you also have graphs and details at your fingertips, and you can easily add new services to monitor while you're out and about. The app is free but, if you want the in-app notifications you'll need to "become pro" through a one-time in-app purchase. The pro model also gets you a dark theme, which is nice.
We opted for using the free tier statping app, plus notifications via email. How urgent can it be, after all?
Install even more self-hosted apps on your Raspberry Pi or home server
System stability is always a potential worry when you're flushing big tech out of your life and replacing it with your own self-hosted software. With statping-ng, you can be reasonably confident that if anything fails, you can find out and fix it straight away. This gives you the excuse to try out even more self-hosted options.
In addition to the self-hosted projects mentioned above, we recommend trying FreshRSS, PiHole, and PhotoPrism.